Create geofacet plot of population trajectories by province/state
Source:R/plot-geofacet.R
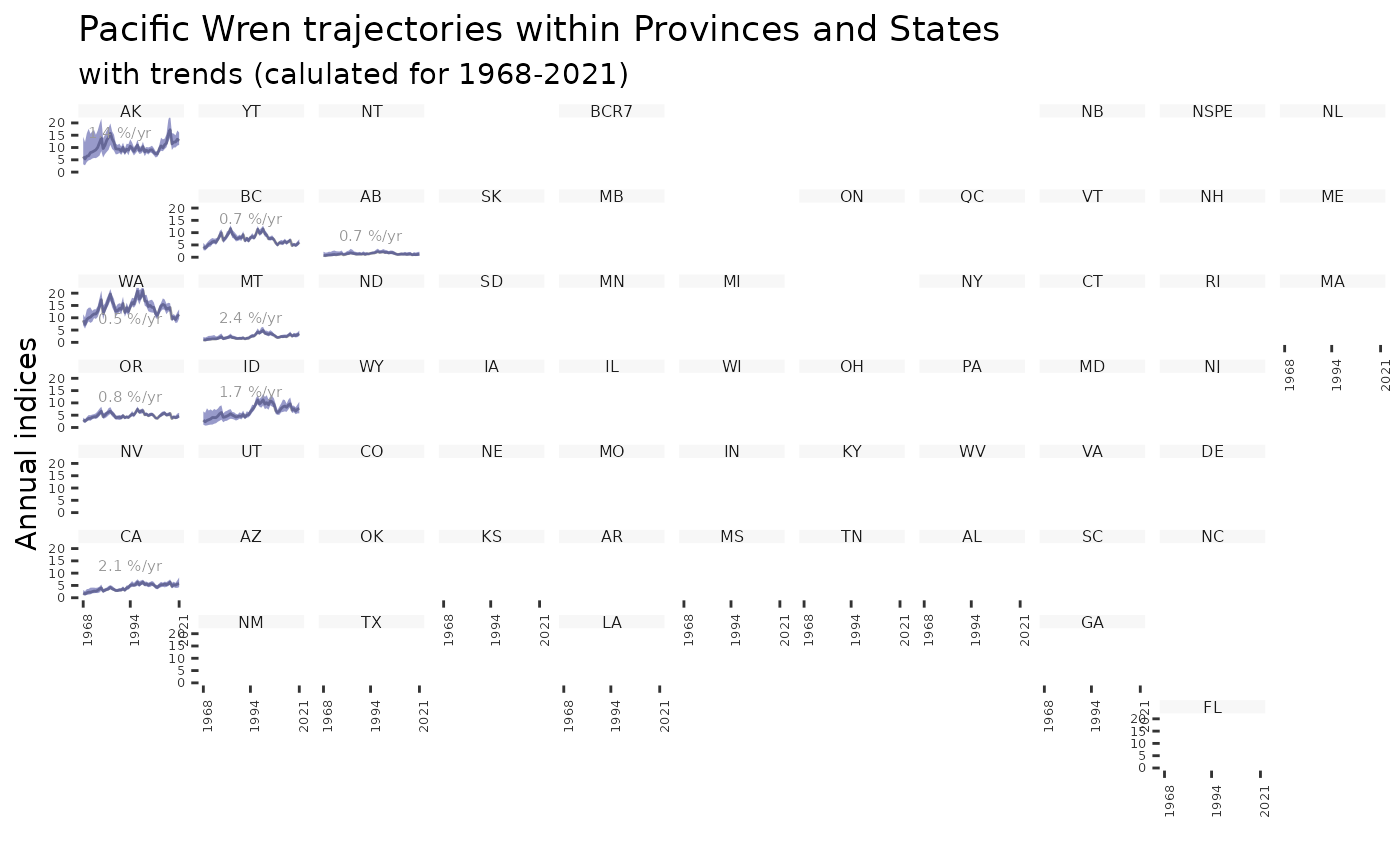
plot_geofacet.RdGenerate a faceted plot of population trajectories by province/state. Only
possible if indices created by generate_indices() include the prov_state
region. All geofacet plots have one facet per state/province, so if there are
multiple strata per facet, these can be plotted as separate trajectories
within each facet (multiple = TRUE).
Usage
plot_geofacet(
  indices,
  ci_width = 0.95,
  multiple = FALSE,
  trends = NULL,
  slope = FALSE,
  add_observed_means = FALSE,
  col_viridis = FALSE
)
Arguments
- indices
List. Indices generated by
generate_indices().- ci_width
Numeric. Quantile defining the width of the plotted credible interval. Defaults to 0.95 (lower = 0.025 and upper = 0.975). Note these quantiles need to have been precalculated in
generate_indices().- multiple
Logical. Whether to plot multiple strata-level trajectories within each prov/state facet. Default
FALSE.- trends
List. (Optional) Output generated by
generate_trends(). If included trajectories are coloured based on the same colour scale used inplot_map.- slope
Logical. If
trendsincluded, whether colours in the plot should be based on slope trends. DefaultFALSE.- add_observed_means
Logical. Whether to include points indicating the observed mean counts. Default
FALSE. Note: scale of observed means and annual indices may not match due to imbalanced sampling among routes. Also, pattern of change in observed means through time should reflect estimated population trajectories for strata-level summaries. However, the temporal patterns may be very different between means and annual indices for composite regions (e.g., continental, state, province, or BCR) because the indices for composite regions account for the variation in area weights and variation in relative abundances among strata, and the observed mean counts do not. For strata-level assessments, these observed means can be a useful model assessment tool. For composite regions, their interpretation is more complicated.- col_viridis
Logical. Should the colour-blind-friendly "viridis" palette be used. Default
FALSE.
See also
Other indices and trends functions:
generate_indices(),
generate_trends(),
plot_indices(),
plot_map()
Examples
# Using the example model for Pacific Wrens...
# Generate indices
i <- generate_indices(pacific_wren_model,
regions = c("stratum", "prov_state"))
#> Processing region stratum
#> Processing region prov_state
# Generate trends
t <- generate_trends(i)
# Now make the geofacet plot.
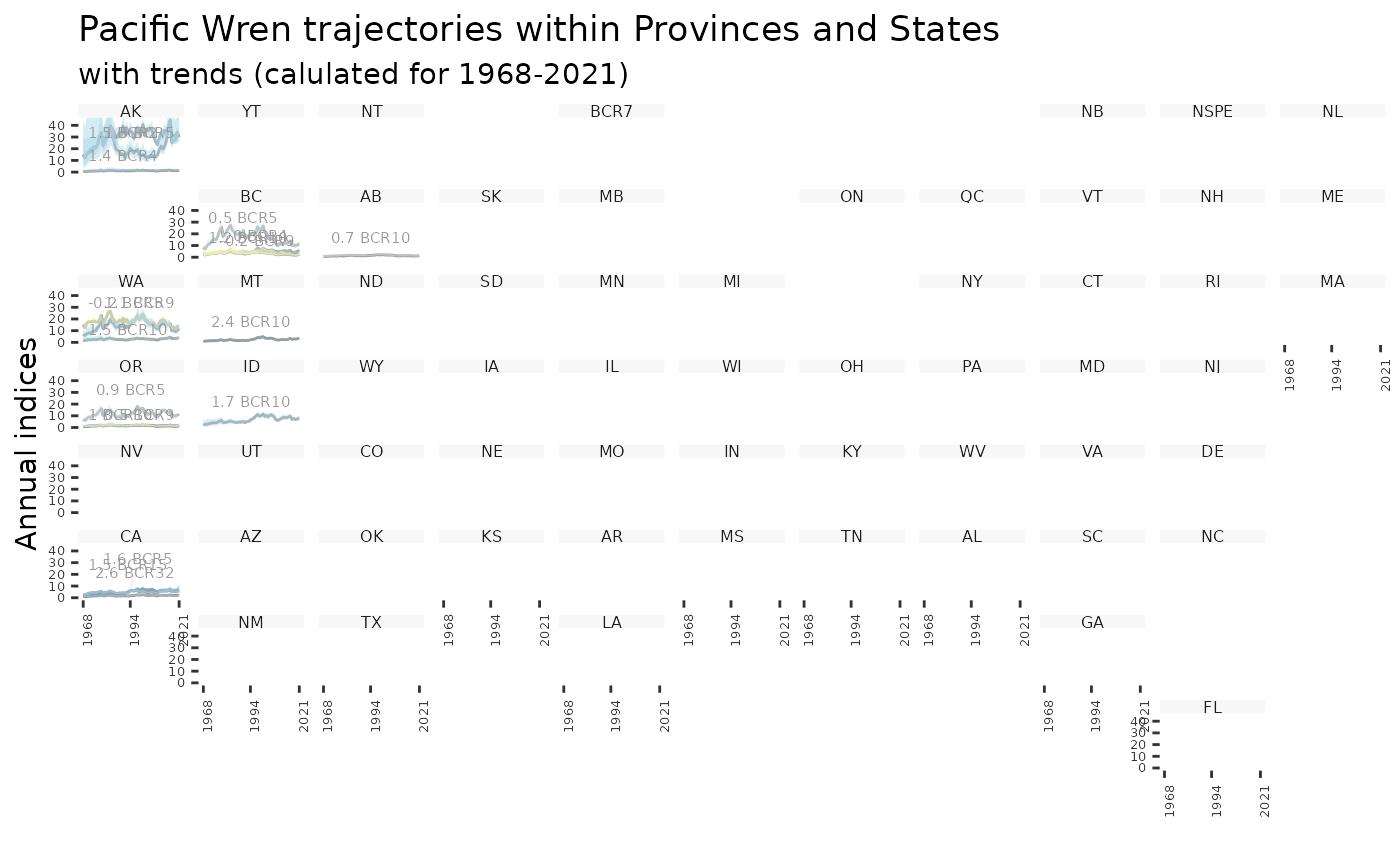
plot_geofacet(i, trends = t, multiple = TRUE)
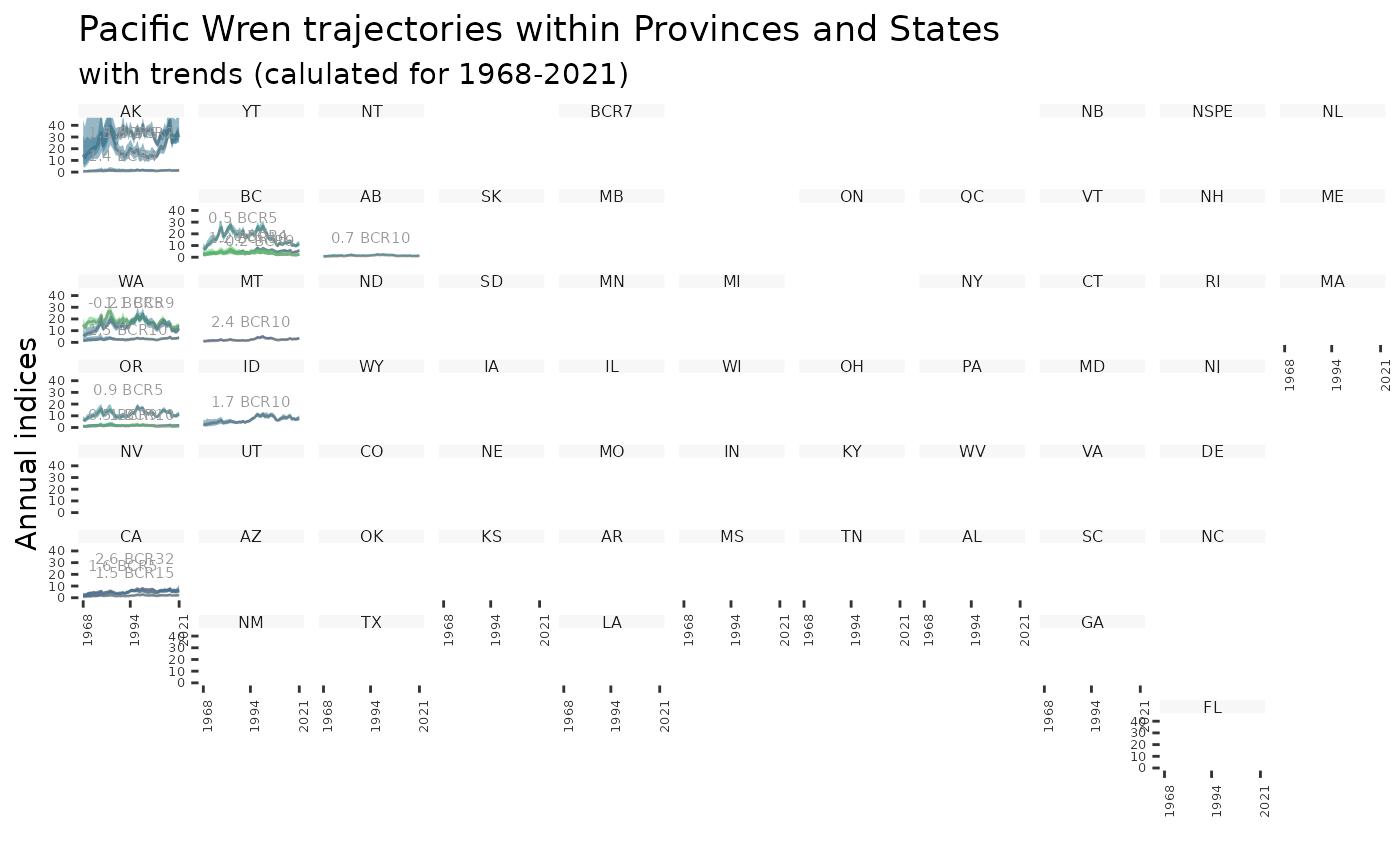
 plot_geofacet(i, trends = t, multiple = TRUE, col_viridis = TRUE)
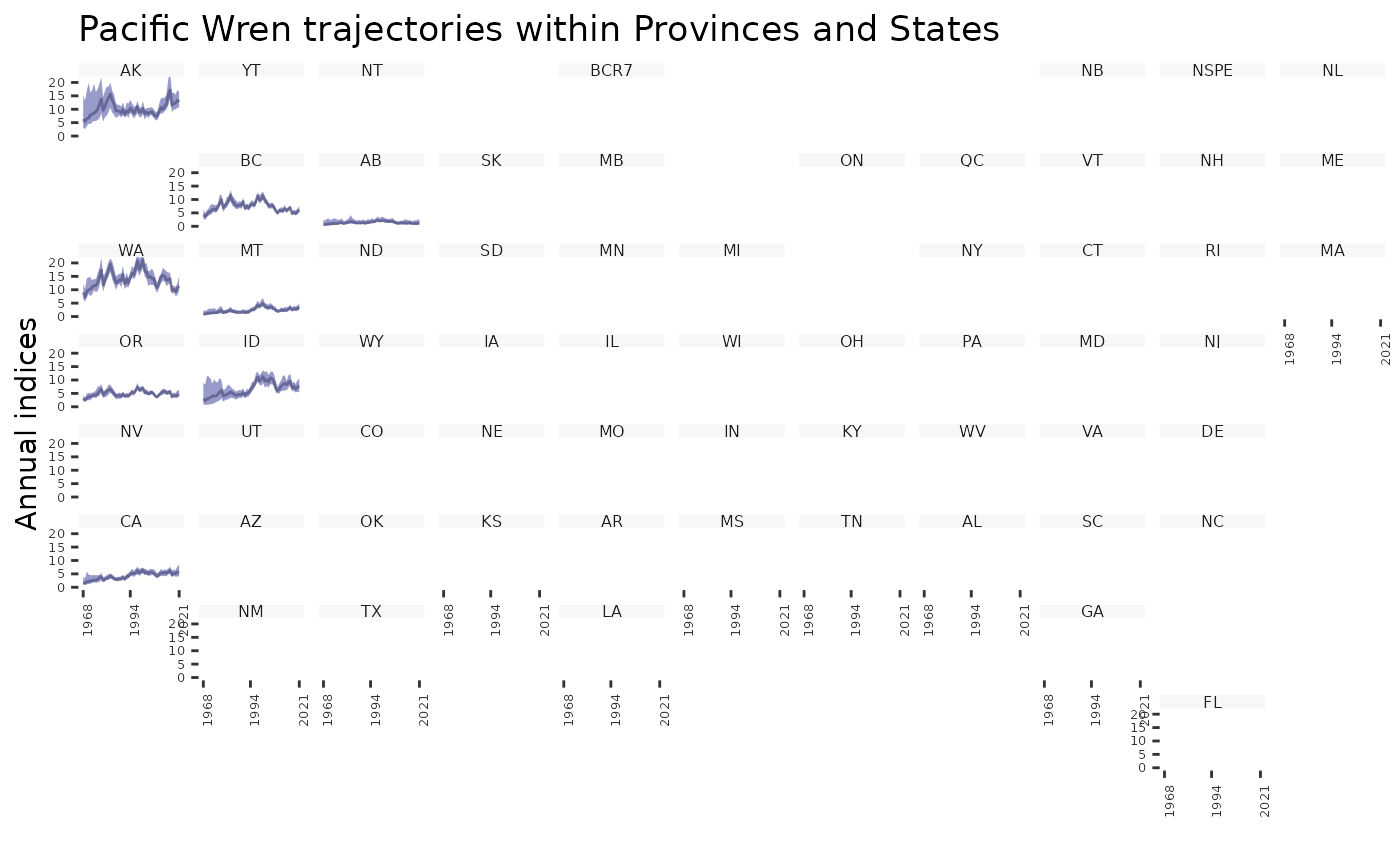
 plot_geofacet(i, multiple = TRUE)
 plot_geofacet(i, trends = t, multiple = FALSE)
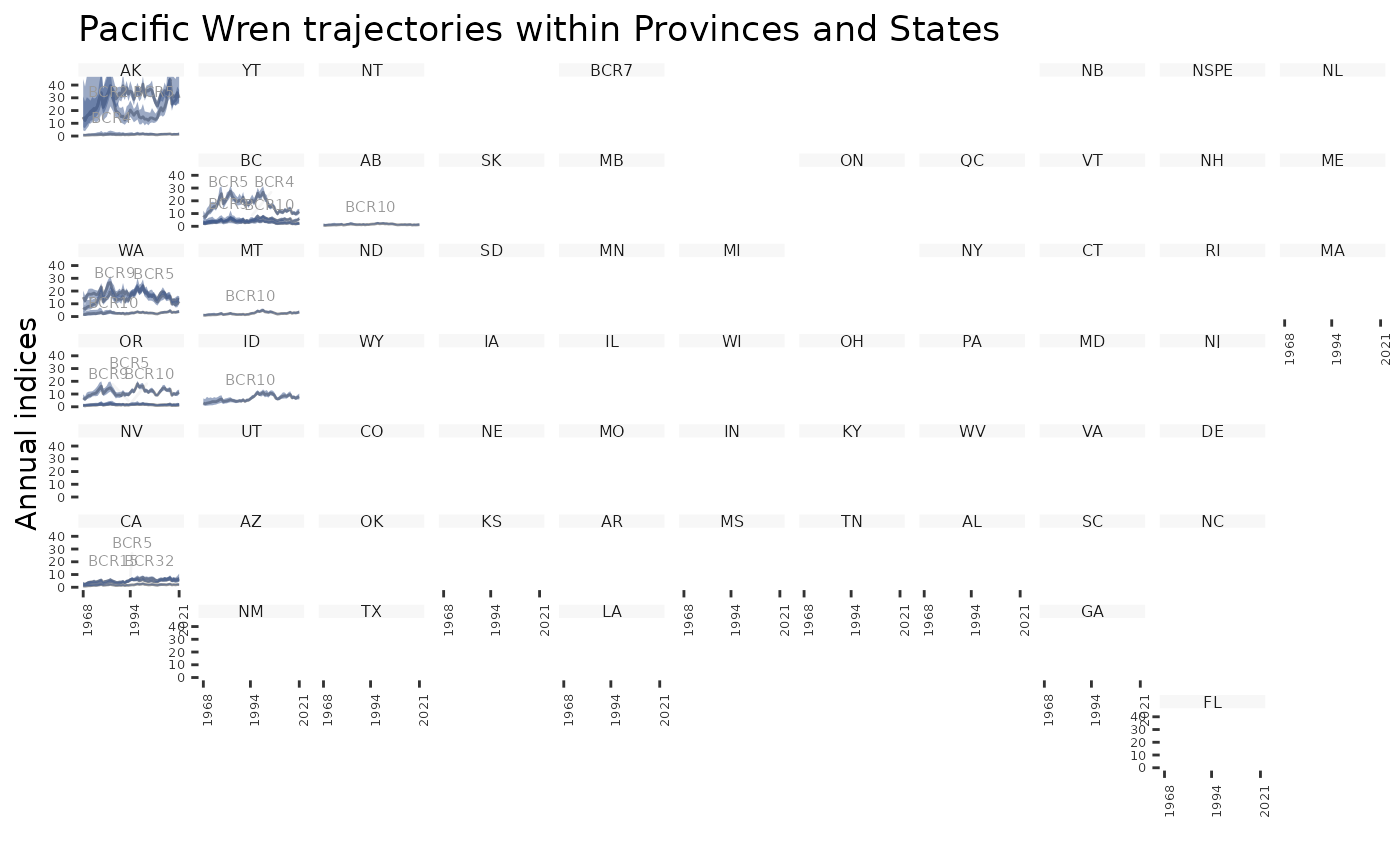
 plot_geofacet(i, multiple = FALSE)
 # With different ci_width, specify desired quantiles in indices
i <- generate_indices(pacific_wren_model,
regions = c("stratum", "prov_state"),
quantiles = c(0.005, 0.995))
#> Processing region stratum
#> Processing region prov_state
plot_geofacet(i, multiple = FALSE, ci_width = 0.99)
# With different ci_width, specify desired quantiles in indices
i <- generate_indices(pacific_wren_model,
regions = c("stratum", "prov_state"),
quantiles = c(0.005, 0.995))
#> Processing region stratum
#> Processing region prov_state
plot_geofacet(i, multiple = FALSE, ci_width = 0.99)